Phase Diagrams are limited in their usefulness because they can only predict the microstructure that will result for equilibrium conditions, i.e. very very slow cooling. Non-equilibrium cooling will result in different microstructures resulting in altered properties. Time and temperature of austenite transformation has profound influence on the transformation products and subsequent properties of steel. For study of non-equilibrium cooling, information about isothermal transformation diagram and cooling curves is given in this article.
Construction and Study of I-T Diagram
Since austenite is unstable below the lower critical temperature Ae1, it is necessary to know at a particular subcritical temperature how long it will take for the austenite to start to transform, how long it will take to be completely transformed, and what will be the nature of the transformation product.
T (Time) T (Temperature) T (Transformation) diagram is a plot of temperature versus the logarithm of time for a steel alloy of definite composition. It is used to determine when transformations begin and end for an isothermal (constant temperature) heat treatment of a previously austenitized alloy. One can understand the isothermal-transformation diagram by study of their derivations. As there is no proeutectoid constituent present in the microstructure of eutectoid composition steel (0.8 percent carbon), its study is the simplest. Construction of its I-T diagram is explained below.
The steps usually followed to determine an isothermal-diagram are as under.
Step 1: Prepare a large number of samples cut from the same bar. Their cross section has to be small in order to react quickly to change in temperature.
Step 2: Place the samples in a furnace or molten salt bath at the proper austenitizing temperature. For 1080 (eutectoid) steel, this temperature is approximately 1425°F. They should be left at the given temperature long enough to become completely austenite.
Step 3: Place the samples in a molten salt bath which is held at a constant subcritical temperature (a temperature below the Ae1 line), for example, 675°C.
Step 4: After varying time intervals in the salt bath, each sample is quenched in cold water or iced brine.
Step 5: After cooling, each sample is checked for hardness and studied microscopically.
Step 6: The above steps are repeated at different subcritical temperatures until sufficient points are determined to plot the curves on the diagram.
We are really interested in knowing what is happening to austenite at 675°C, but the samples cannot be studied at that temperature. Therefore, we must somehow be able to relate the room-temperature microscopic examination to what is occurring at the elevated temperature. Following two facts will help in correlating microstructure at room temperature to the microstructure at the elevated temperature.
Fact 1: Martensite is formed only from austenite almost instantaneously at low temperatures.
Fact 2: If austenite transforms at a higher temperature to a structure which is stable at room temperature, rapid cooling will not change the transformation product. In other words, if pearlite is formed at 675°C, the pearlite will be exactly the same at room temperature no matter how drastically it is quenched, since there is no reason for the pearlite to change.
Based on above facts and study of microstructures of various samples at room temperature, two points may be plotted at 675°C, namely, the time for the beginning (point A corresponding to time T1) and the time for the end of transformation (point B corresponding to time T2) as shown in the figure given below. It is also common practice to plot the time for 50 percent transformation (point C).
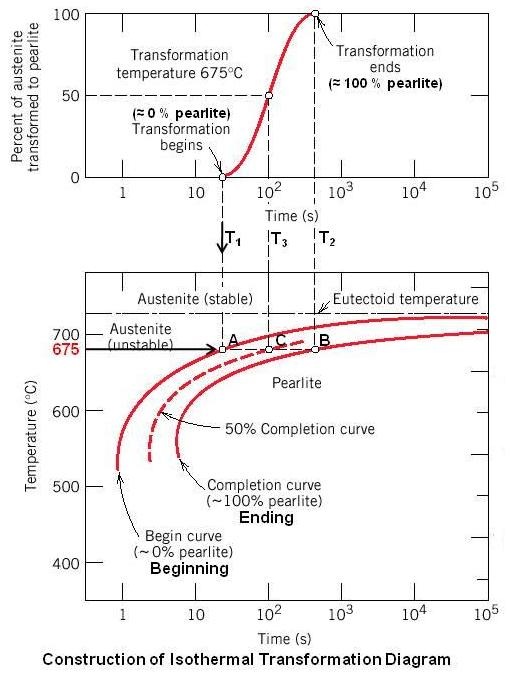
The entire experiment is repeated at different subcritical temperatures until sufficient points are determined to draw one curve showing the beginning of transformation, another curve showing the end of transformation and a dotted curve in between showing 50 percent transformed.
The principal curves on the I-T diagram are drawn as broad lines to emphasize that their exact location on the time scale is not highly precise. Portions of these lines are often shown as dashed lines to indicate a much higher degree of uncertainty. Time is plotted on a logarithmic scale so that times of few seconds as well as times of 1 day or week can be fitted into a reasonable space and yet permits an open scale in the region of short times. The diagram is known as an I-T (isothermal-transformation) diagram. Other names for the same curves are TTT (transformation, temperature, time) curves or S curves.
The I-T diagram for 1080 eutectoid steel is shown in the figure given below.

Above the Ae1 austenite is stable. The area to the left of the beginning of transformation consists of unstable austenite. The area to the right of the end-of-transformation line is the product to which austenite will transform at constant temperature. The area between the beginning and the end of transformation labeled A + P and A + B consists of three phase, austenite, ferrite and carbide or austenite plus the product to which it is transforming (P – pearlite or B – bainite). The point on the beginning of the transformation line farthest to the left is known as the nose of the diagram. In all diagrams, except the one for eutectoid steel, there is an additional line above the nose region. This line (first line on the left) indicates the beginning of austenite transformation to proeutectoid ferrite in hypoeutectoid steels or proeutectoid cementite in hypereutectoid steels. The second line indicates the beginning of austenite transformation to pearlite. The area between the two lines is labeled as A + F (austenite plus proeutectoid ferrite), or A + C (austenite plus proeutectoid cementite). These two lines generally merge at the nose region.
Figure given below, TimeTemperatureTransformation (TTT) curve for carbon steel AISI 1050 (a hypoeutectoid steel) will help understanding what is meant by additional line above the nose region.
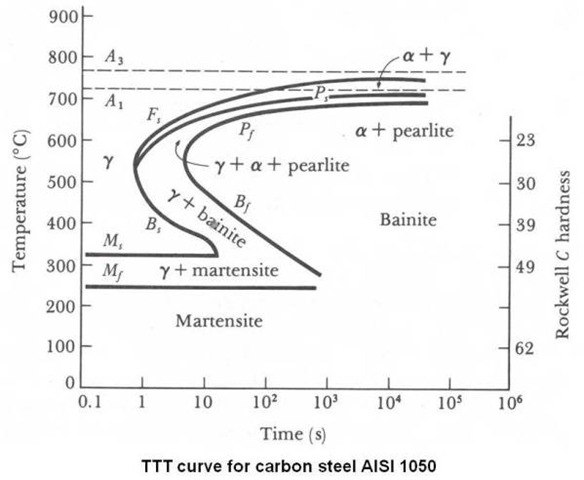
The horizontal Ms line shows the temperature at which martensite transformation will start. Two more horizontal lines (some times shown as arrows pointing to the temperature scale) M50 and M90 indicate the temperature at which 50 and 90 percent of total austenite will, on quenching, have transformed to martensite.
The transformation product above the nose region is pearlite. The pearlite microstructure is the characteristic lamellar structure of alternate layers of ferrite and cementite. Just below the Ae1 line, coarse lamellar pearlite is formed with a hardness of about Rockwell C 15. As the transformation temperature decreases, the characteristic lamellar structure is maintained, but the spacing between the ferrite and carbide layers becomes increasingly smaller, until the separate layers cannot be resolved with the light microscope. With decrease in temperature of transformation, fineness of pearlite will increase resulting in increased harness.
Between the nose region of approximately 950°F and the Ms temperature, a new, dark-etching aggregate of ferrite and cementite appears. This structure, named after E. C. Bain, is called Bainite.
At upper temperature of the transformation range, it resembles pearlite and is known as upper or feathery bainite. At low temperatures it appears as a black needlelike structure resembling martensite and is known as lower or acicular bainite.
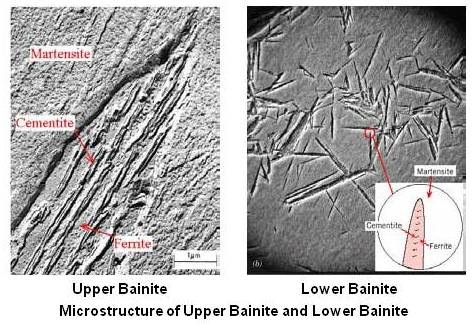
Above figure shows typical microstructures of upper bainite and lower bainite. Upper bainite consists of tiny cementite platelets generally oriented parallel with the long direction of the ferrite needles. As the transformation temperature decreases, in lower bainite, the ferrite needles become thinner and the carbide platelets become smaller and more closely spaced. The carbide platelets are usually oriented at an angle of about 55° to the long axis of the ferrite needles, rather than parallel.
The hardness of bainite varies from about Rockwell C 40 for upper bainite to about Rockwell C 60 for lower bainite. This increase in hardness, as with pearlite, is a reflection of the decrease in size and spacing of the carbide platelets as the transformation temperature decreases.
Whereas pearlite is nucleated by a carbide crystal, bainite is nucleated by a ferrite crystal, and this result in a different growth pattern as shown in the figure given below.
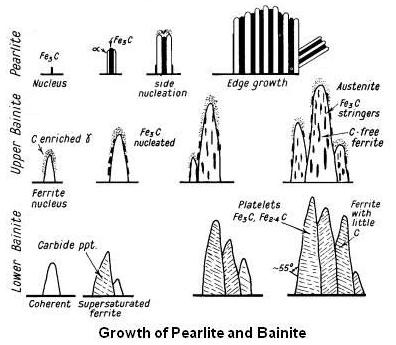
As shown in above figure, in case of pearlite, on cooling it first forms nuclei of carbide followed by ferrite and it grows by side nucleation and edge growth.
In case of upper bainite, between about 500° and 350°C initial nuclei are ferrite which is coherent with the austenite matrix. Cementite then precipitates from the carbon-enriched layer of austenite, allowing further growth of the ferrite. The carbides tend to lie parallel to the long axis of the bainite needle to form the typical open feathery structure of upper bainite.
In case of lower bainite, below 350° C, coherent ferrite, supersaturated with carbon, forms first and is then followed by the precipitation of carbide within the ferrite needle, transversely at an angle of 55°. A proportion of the carbide is Fe2.4C and the ferrite contains a little dissolved carbon. This lower bainite structure is somewhat similar to lightly tempered martensite.
Cooling Curves and the I-T Diagram
A cooling curve is determined experimentally by placing a thermocouple at a definite location in a steel sample and then measuring the variation of temperature with time.
Since the coordinates of the I-T diagram are the same as those for a cooling curve, it is possible to superimpose various cooling curves on the I-T diagram. This is shown in the figure given below.
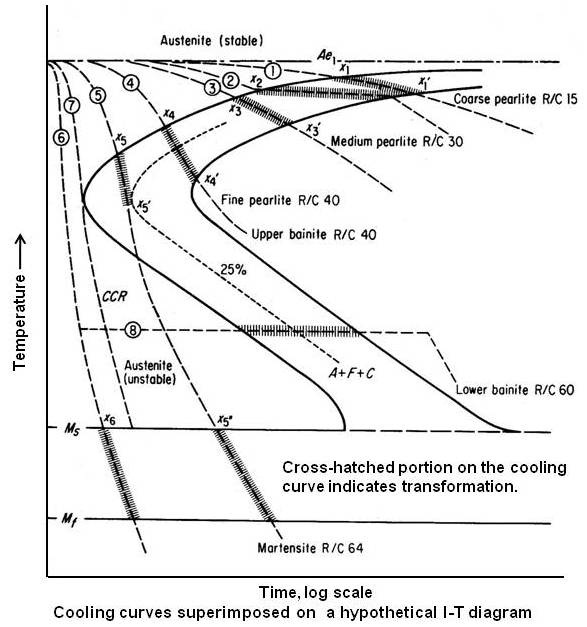
Cooling curve 1 shows a very slow cooling rate typical of conventional annealing. The diagram indicates that the material will remain austenitic for a relatively long period of time. Transformation will start when the cooling curve crosses the beginning of transformation at point x1. The transformation product at that temperature will be very coarse pearlite. Transformation will continue until point x’1. Since there is a slight difference in temperature at the beginning and end of transformation, there will be a slight difference in the fineness of pearlite formed at the beginning and at the end. The overall product will be coarse pearlite with low hardness. Below the temperature of x’1 the rate of cooling will have no effect on the microstructure or properties. The material may now be cooled rapidly without any change occurring. This is very important for companies doing commercial annealing, since the diagram indicates that it is not necessary to cool in the furnace to room temperature but that the material may be removed at a relatively high temperature after transformation and cooled in air.
Cooling curve 2 illustrates “isothermal†or “cycle annealing†and was developed directly from the I-T diagram. The process is carried out by cooling the material rapidly from above the critical range to a predetermined temperature in the upper portion of the I-T diagram and holding for the time indicated to produce complete transformation. In contrast to conventional annealing, this treatment produces a more uniform microstructure and hardness, in many cases with a shorter time cycle.
Cooling curve 3 is a faster cooling rate than annealing and may be considered typical of normalizing. The diagram indicates that the transformation will start at x3, with the formation of coarse pearlite, in a much shorter time than annealing. Transformation will be complete at x’3 with the formation of medium pearlite. Since there is a greater temperature difference between x3 and x’3 than there is between x1 and x’1, the normalized microstructure will show a greater variation in the fineness of pearlite and a smaller proportion of coarse pearlite than the annealed microstructure.
Cooling curve 4, typical of a slow oil quench, is similar to the one just described, and the microstructure will be a mixture of medium and fine pearlite.
Cooling curve 5, typical of an intermediate cooling rate, will start to transform (at x5) to fine pearlite in a relatively short time. The transformation to fine pearlite will continue until the curve becomes tangent to some percentage transformed, say 25 percent, at x’5. Below this temperature, the cooling curve is going in a direction of decreasing percent transformed. Since pearlite cannot form from austenite on cooling, the transformation must stop at x’5. The microstructure at this point will consist 25 percent of fine, nodular pearlite largely surrounding the existing austenitic grains. It will remain in this condition until the Ms line is crossed at x’’5. The remaining austenite now transforms to martensite. The final microstructure at room temperature will consist of 75 percent martensite and 25 percent fine nodular pearlite largely concentrated along the original austenite grain boundaries.
Cooling curve 6, typical of a drastic quench, is rapid enough to avoid transformation in the nose region. It remains austenitic until the Ms line is reached at x6. Transformation to martensite will take place between Ms and Mf lines. The final microstructure will be entirely martensite of high hardness.
It is apparent that to obtain fully martensite structure it is necessary to avoid transformation in the nose region. Therefore, cooling rate 7, which is tangent to the nose, would be approximate critical cooling rate (CCR) for this steel. Any cooling rate slower than the one indicated will cut the curve above the nose and form some softer transformation product. Any cooling rate faster than the one illustrated will form only martensite. Thus different steels may be compared on the basis of their critical cooling rates.
It may be noted that it is possible to form 100 percent pearlite or 100 percent martensite by continuous cooling, but it is not possible to form 100 percent bainite. A complete bainite structure may be formed only by cooling rapidly enough to miss the nose of the curve and then holding it in the temperature range at which bainite is formed until transformation is complete. This is illustrated by cooling at rate 6 and then 8 in the figure given above.
Transformation on Continuous Cooling
Theoretically, cooling-rate curves should not be superimposed on the I-T diagram as it was done in the previous section. The I-T diagram shows the time-temperature relationship for austenite transformation only as it occurs at constant temperature, but most heat treatment involve transformation on continuous cooling. It is possible to derive from I-T diagram another diagram which will show the transformation under continuous cooling. This is referred to as the C-T diagram (cooling-transformation diagram). The figure given below shows the C-T diagram for eutectoid steel superimposed on the I-T diagram from which it was derived.
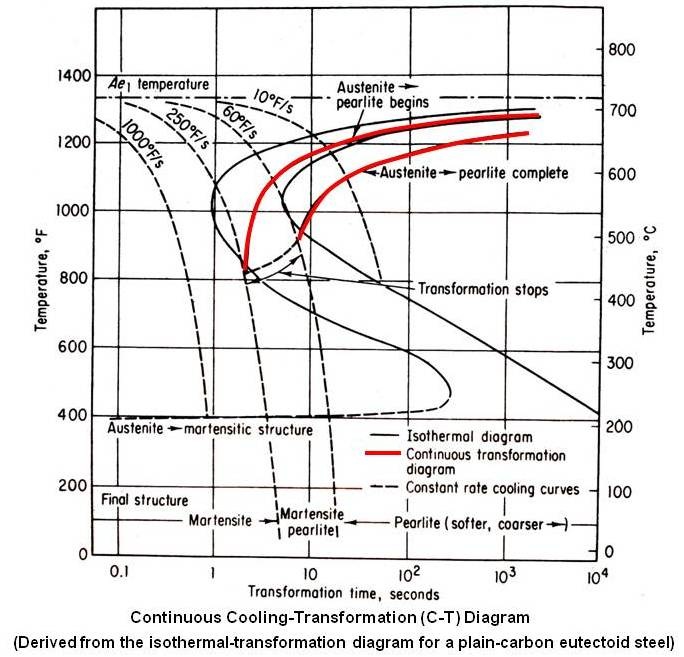
Consideration of the I-T diagram in relation to the location of lines of the C-T diagram shows that the “nose†has been moved downward and to the right by continuous cooling. The critical cooling rate tangent to the nose of the C-T diagram is shown 250° F/s. This is some what slower than the rate indicated by the I-T diagram. Therefore, the use of isothermal “nose†times to determine the required cooling rates will lead to some error, however, the error will be on the safe side in indicating a slightly faster cooling rate than is actually necessary to form only martensite. Austenite-to-Bainite region is not there in the C-T diagram. In this steel the bainite range is “sheltered†by the overhanging pearlite nose.
The derivation of a C-T diagram is a tedious task and, for many purposes, not essential. The I-T diagram is useful in planning heat treatments and in understanding why steel responds as it does to a particular heat treatment, but it cannot be used directly to predict accurately the course of transformation under continuous cooling.
Position of the I-T Curves
There are only two factors that will change the position of the curves of the I-T diagram, namely, chemical composition and austenitic grain size. With few exceptions, an increase in carbon or alloy content or in grain size of austenite always retards transformation (moves the curves to the right), at least at temperatures at or above the nose region. This in turn slows up the critical cooling rate, making it easier to form martensite. This retardation is also reflected in the greater hardenability, or depth of penetration of hardness, of steel with higher alloy content or larger austenitic grain size. This is one of the principal reasons for alloying steel.
While the addition of alloying elements does not affect the maximum hardness attainable from the steel, that property being controlled by carbon content only, they make it much easier to completely harden the steel. A plain carbon steel may have to be water-quenched to obtain full hardness, while the same steel when alloyed may attain the same hardness and may be hardened to a greater depth even when cooled more slowly by oil quenching. The use of a slower cooling rate reduces the danger of distortion and cracking during heat treatment. While coarsening the austenitic grain size has an effect similar to that of adding alloying elements, the coarser grain will tend to reduce the toughness of the steel. Therefore, if it is desired to reduce the critical cooling rate, this may be done best by changing the chemical composition rather than by coarsening the austenitic grain.
Homogeneity of Austenite
When hypoeutectoid steel is heated for hardening, when the line A1 is crossed, the austenite grains formed from pearlite will contain 0.8 percent carbon. With continued heating, the austenite grains will form from proeutectoid ferrite with little carbon content. So when A3 line is crossed, austenite grains will not be uniform in carbon content. On quenching, the austenite grains leaner in carbon, having a fast critical cooling rate, tend to transform to nonmartensitica structures while those richer in carbon, having a slower critical cooling rate, tend to form martensite. This results in a nonuniform microstructure with variable hardness. This condition may be avoided by very slow heating so that uniformity is established by carbon diffusion during heating. However, the excessive time required by this method does not make it commercially practical. A more suitable method is to soak the material at austenitizing temperature. At this temperature diffusion of carbon is rapid, and uniformity will be established in a short time. To be on the safe side, it is recommended that the material be held at the austenitizing temperature 1 hour for each inch of thickness or diameter.
