Crystallization is the transformation from the liquid to the solid state and occurs in two stages – nuclei formation and crystal growth. Information about process of crystallization is given in this article.
The states of Matter
Matter exists in three states – gas, liquid and solid. In the gaseous state the atoms move rapidly at random and are widely separated so that the attractive forces between them are negligible. As they travel they collide with each other and the walls of the container. The combination of all the collisions with the wall is the pressure of the gas.
At some lower temperature, the kinetic energy of the atoms decreases and the attractive forces become large enough to bring most of the atoms together in a liquid state.
As the temperature decreases further, the motion becomes less vigorous and the attractive forces pull the atoms close together until the liquid solidifies. Most materials contract upon solidification indicating a closer packing of atoms in the solid state. The atoms in the solid state are not stationary. They are vibrating around fixed points in the orderly arrangement of crystal structure.
Process of Crystallization
Atomic motion in the liquid state of a metal is almost completely disordered. Although the atoms in the liquid state do not have any definite arrangement, it is possible that some atoms at any given instant are in positions exactly corresponding to the space lattice they assume when solidified. As the energy in the liquid system decreases, the movement of the atoms decreases and the probability increases for the arrangement of a number of atoms into a characteristic lattice for that material. The energy level at which these isolated lattices form is called the freezing temperature.
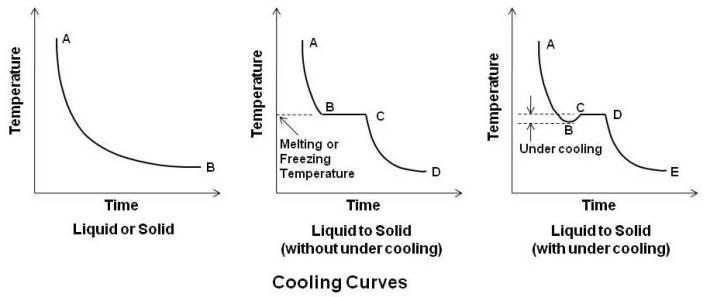
When a pure metal – solid or liquid at a temperature considerably above its surroundings is allowed to cool without change of state, a time-temperature cooling curve AB (curve on left side in above figure) is obtained. In the beginning the slop of the curve is steep owing to a large difference between the temperature of the metal and its surroundings followed by a more gradual fall in temperature.
Atoms in a material have both kinetic and potential energy. Kinetic energy is related to the speed at which the atoms move and is strictly a function of temperature. Higher is the temperature, higher is their kinetic energy and atoms are more active. Potential energy on the other hand is related to the distance between atoms (energy due to position). The greater is the distance between the atoms, the greater is their potential energy.
Now consider a pure metal at its freezing point where both the liquid and solid state are at the same temperature. As temperature is same, the kinetic energy of the atoms in the liquid and solid state must be the same, but there is significant difference in potential energy. In case of liquid, its potential energy is higher than that of solid as distance between atoms in liquid state is more than that in solid state. Thus, solidification occurs with a release of energy. This energy, the difference in potential energy between the liquid and solid state is known as the latent heat of fusion. This is shown by horizontal line BC in cooling curve (middle curve in above figure) for liquid to solid (without under cooling). The curve AB is regular cooling curve for liquid up to the freezing point B, and is then followed by the horizontal curve BC. The atoms which hitherto had a random motion now occupy fixed positions, or, in other words the liquid crystallizes. Crystallization commences at B and completes at C. At point C, metal is in totally solid state. Thereafter, the horizontal cure BC is followed by a regular curve CD in the solid state.
In the absence of any suitable solid nuclei, a liquid faces considerable difficulty in commencing crystallization, and it may actually cool below its real freezing point before solidification begins as shown by curve AB in cooling curve (left curve in above figure) for liquid to solid (with under cooling). Temperature at B is below freezing temperature. Nuclei or seed crystals are formed at this temperature around which crystallization proceeds and the temperature rises to true freezing temperature as shown by point C. Crystallization completes at point D. Thereafter, the horizontal curve CD is followed by a regular curve DE in the solid state.
The amount of under cooling required to form nuclei or seed crystals may be reduced by the presence of solid impurities in the pure metal.
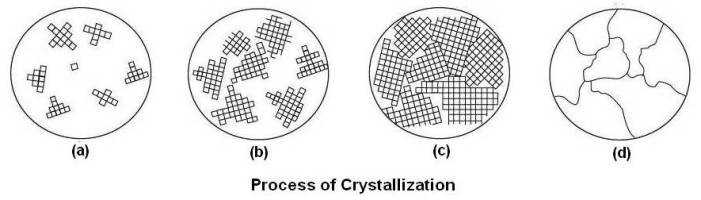
(a) Spontaneous appearance of nuclei at various points in the liquid
(b) Growth of nucleus (crystal)
(c) Mutually obstruction in dendrites
(d) Grains and grain boundaries as seen in a microscope
Above figure shows schematically the process of crystallization from nuclei to the final grins.
When the temperature of liquid metal has dropped sufficiently below its freezing temperature, nuclei (seed crystals) appear spontaneously at various points in the liquid as shown at (a) in above figure. These nuclei, which have solidified, act as centers for further crystallization. As cooling continues, more atoms tend to freeze, and they may attach to themselves to already existing nuclei or form new nuclei of their own. Each nucleus grows by the attraction of atoms from the liquid into its space lattice as shown at (b) in above figure. Crystal growth continues in three dimensions, the atoms attaching themselves in certain preferred directions, usually along the axes of the crystal. This gives rise to a characteristic fir-tree appearance known as dendrite. Since each nucleus is formed by chance, the crystal axes are pointed at random and the dendrites growing from them will grow in different directions in each crystal. Finally, as the amount of liquid decreases, the gaps between the arms of the dendrite will be mutually obstructed by that of its neighbors as shown at (c) in above figure. This leads to very irregular external shape. The crystals found in all commercial metals are commonly called grains because of this variation in external shape. The grains and grain boundaries as seen in a microscope are shown at (d) in above figure. The area along which crystals meet, known as grain boundary, is a region of mismatch. This leads to a noncrystalline (amorphous) structure at the grain boundary with the atoms irregularly spaced as shown below.
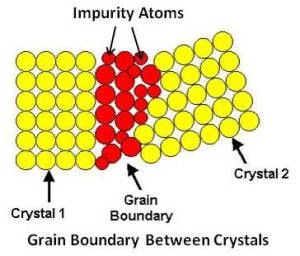
Since the last liquid to solidify is generally along the grain boundaries, there tends to be a higher concentration of impurity atoms in that area.
Crystal Imperfections
Under normal solidification process, most crystalline solids are made up of a large number of small interlocking crystals or grains and they are known as polycrystalline materials. It is possible under carefully controlled conditions to manufacture a large single crystal called metal “whiskersâ€. Single crystal approaches a nearly perfect lattice structure.
It is possible to calculate the theoretical strength of a metal by the force required to separate the bond between adjoining atoms. Strength of metal whiskers approaches this strength. However, the ordinary strength of metals is 100 to 1000 times less than the theoretical strength due to defects in crystal structure.
A perfect crystal, with every atom of the same type in the correct position, does not exist. All crystals have some defects. During process of crystallization at a very slow growth rate, such as 1 mm per day, it requires the deposition of about 100 layers of atoms per second on the solid surface. All these atoms must be laid in exactly the right lattice places for the crystal to be perfect. Normal solidification takes place at fast rate resulting in imperfections/defects in crystals.
There are three types of crystal defects:
- Point defects: These are places where an atom is missing or irregularly placed in the lattice structure. Point defects include lattice vacancies and interstitial atoms.
- Linear defects: These are groups of atoms in irregular positions. Linear defects are commonly called dislocations. Two simple types of dislocations are edge dislocation and screw dislocation.
- Planar defects: These are interfaces between homogeneous regions of the material. Grain boundaries explained above are one of the planar defects.
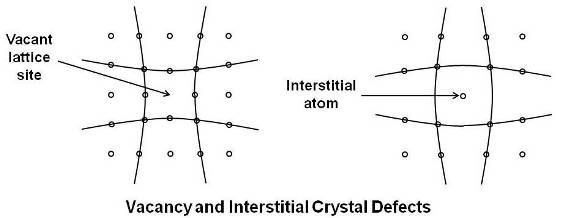
As shown above, vacancies are simply empty atom sites. By successive jumps of atoms, it is possible for a vacancy to move in the lattice structure and therefore play an important part in diffusion of atoms through the lattice. Atoms surrounding a vacancy tend to be closer together distorting the lattice planes. Vacancies are not only present as a result of solidification but can be produced by raising the temperature or by irradiation with fast moving nuclear particles.
As shown in the above figure, it is also possible that some atoms (impurity or solute) may fall into interstitial positions or in the spaces of the lattice structure. Interstitials tend to push the surrounding atoms farther apart and also produce distortion of the lattice planes. Interstitial atoms may be produced by the severe local distortion during plastic deformation as well as by irradiation.
A dislocation may be defined as a disturbed region between two substantially perfect parts of a crystal. A dislocation is a linear defect around which some of the atoms are misaligned.
Edge Dislocation
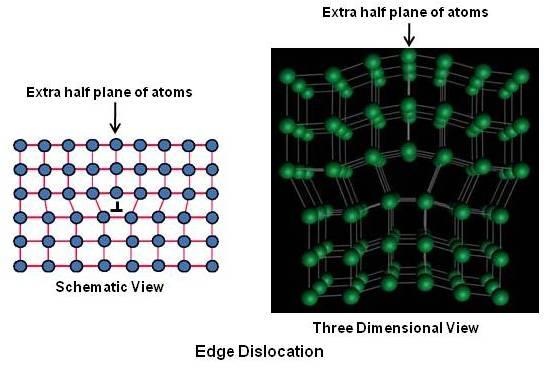
The edge dislocation, shown above can be easily visualized as an extra half plane of atoms in a lattice. The dislocation is called a line defect because the locus of defective points produced in the lattice by the dislocation lie along a line. This line runs along the top of the extra half-plane. The inter-atomic bonds are significantly distorted only in the immediate vicinity of the dislocation line. In a sketch/drawing an edge dislocation is represented as a T or inverted T.
Screw Dislocation
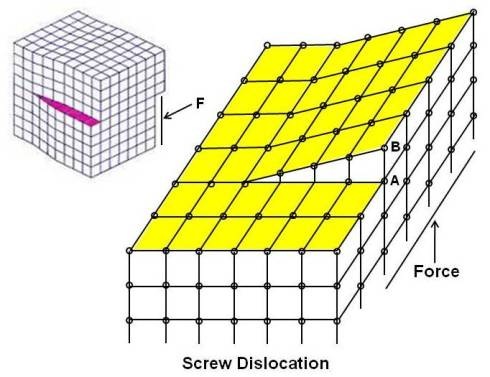
The screw dislocation shown above is slightly more difficult to visualize. Screw dislocation forms when one part of crystal lattice is shifted (through shear) relative to the other crystal part. The dislocation is such that a step or ramp is formed by the displacement of atoms. If one traces the periphery of a crystal with a screw dislocation, the end point would be displaced from the starting point by one lattice space (in above figure, starting point A has moved by one lattice space to end point B). It is called screw as atomic planes form a spiral surface around the dislocation line.
It is important to note at this point that slip – plastic deformation in a material occurs due to the movement of dislocations (linear defects). Dislocations are generated and move when a stress is applied. Millions of dislocations result for plastic forming operations such as rolling and extruding. It is also important to note that any defect in the regular lattice structure disrupts the motion of dislocation, which makes slip or plastic deformation more difficult. This drives up the force needed to move the dislocation or, in other words, strengthens the material.
Various types of crystal defects are shown in the figure given below.

For information on transition lattice, please refer to age hardening in the article Phase Diagrams (Part 2).
Macrodefects in Castings
Crystal imperfections are defects on an atomic scale that arise from solidification. Other defects that may result from solidification are large enough to be visible to the naked eye. These defects are known as macrodefects. The most common macrodefects are shrinkage cavities and porosity.
Liquid metals undergo a contraction in volume due to solidification. This decrease in volume may be as much as 6 percent. In case when entire exterior of a casting solidifies first, the decrease in volume of the interior during solidification will result in a large shrinkage cavity at the mid-section. In solidification of steel ingots, the shrinkage cavity, called pipe, is usually concentrated in the top central portion of the ingot.
Porosity or blowholes occur whenever gases are trapped in the casting. They are usually more numerous and smaller than shrinkage cavities and may be distinguished by their rounded form. Air may be entrapped in the casting by the sudden rush of metal during pouring. Since gases are generally more soluble in liquid metal than the solid, dissolved gases may be liberated during solidification. Gas may also be produced by reaction of the liquid metal with volatile substances, such as moisture, in the mold. Porosity may be greatly reduced by proper venting of the mold, and by not unduly compacting the sand.
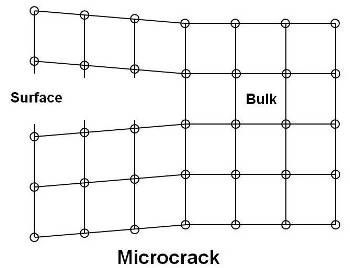
As shown in above figure, a microcrack occurs due to creation of new surfaces due to broken internal bonds. They have a tendency to form on the surface of a solid rather than in the bulk. They also form at grain boundaries and other regions of disorder. A crack is formed by joining of many microcrackes.
Hot tears are cracks due to heavy shrinkage strains set up in the solid casting just after solidification.
Grain Size
The size of grains in a casting is determined by the relation between the rate of growth (of grain) and the rate of nucleation. If the number of nuclei formed is high, a fine grained material will be produced, and only a few nuclei are formed, a coarse grained material will be produced. The rate of cooling is the most important factor in determining the rate of nucleation and therefore the grain size. Rapid cooling (chill cast) will result in a large number of nuclei formed and fine grain size, whereas in slow cooling (sand cast or hot mold) only a few nuclei are formed and they will have a chance to grow, depleting the liquid before more nuclei can form.
Other factors that increase the rate of nucleation, thus promoting the formation of fine grain are insoluble impurities (e.g. aluminum and titanium that form insoluble oxides in steel) and stirring the melt during solidification which tends to break up the crystals before they have chance to grow very large.
In general, fine grained materials exhibit better toughness or resistance to shock. This is due to frequent change in direction of force (at grain boundaries) to cause rupture in fine grained material due to large number of grains. Fine grained materials are also harder and stronger than coarse grained materials.
Grain Size Measurement
Comparison method is one of the basic methods recommended by ASTM for grain size estimation. In the comparison method, the specimen is prepared and etched as per metallographic procedure. Its photo micrograph at 100x is compared with a series of graded standard grain size charts (ASTM E112). By trial and error a match is secured, and the grain size of the metal is then designated by a number corresponding to the index number of the matching chart.
The ASTM grain-size number n may be obtained as follows.
N = 2(n-1)
Where N is the number of grains observed per square inch at 100x magnification (see table below).
| Grain size number (n =) | Grains per square inch at 100x | |
|---|---|---|
| Mean number (N =) | Number of grains (Range) | |
| 1 | 1 | - |
| 2 | 2 | 1.5 – 3 |
| 3 | 4 | 3 – 6 |
| 4 | 8 | 6 – 12 |
| 5 | 16 | 12 – 24 |
| 6 | 32 | 24 – 48 |
| 7 | 64 | 48 – 96 |
| 8 | 128 | 96 – 192 |
| 9 | 256 | 192 – 384 |
| 10 | 512 | 384 – 768 |
It may be noted that higher is the grain size number (n), more number of grains per square inch at 100x magnification and finer is the material.
