In article titled Phase Diagrams (Part 1), information about a phase diagram where components of the alloy were completely soluble in both the liquid and solid states (Type I) was given. In this article, information is given about remaining types of phase diagrams and transformations in the solid state as under.
1. Components completely soluble in the liquid state and
a. Insoluble in the solid state: the eutectic reaction (Type II)
b. Partly soluble in the solid state: the eutectic reaction (Type III)
c. Formation of a congruent-melting intermediate phase (Type IV)
d. The peritectic reaction (Type V)
2. Transformations in the solid state
a. Allotropic change
b. Order-disorder
c. The eutectoid reaction
d. The peritectoid reaction
Two Metals Completely Soluble in the Liquid State and Completely Insoluble in the Solid State (Type II)
Technically, no two metals are completely insoluble in each other. However, in some cases the solubility is so restricted that for practical purpose they may be considered insoluble. The series of cooling curves for the pure metals and various alloys are shown in the figure given below.
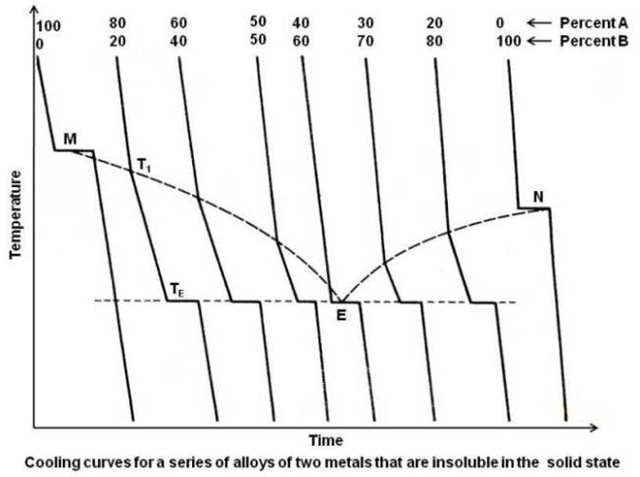
As expected, the cooling curves for the pure metals A and B show a single horizontal line at their freezing points. As B is added to A, the temperature for the beginning of solidification is lowered. As A is added to B, the temperature for the beginning of solidification for those alloys is also lowered. Therefore, since each metal lowers the freezing point of the other, the line connecting the points showing the beginning of solidification, the liquidus line, must show a minimum. This is shown by the upper dotted line in the above figure, showing a minimum at point E, known as the eutectic point, for a composition of 40A-60B. It can be seen that over a wide range of compositions, a portion of the cooling curve that shows the end of solidification occurs at a fixed temperature. The lower horizontal line at TE, shown dotted in the above figure, is known as eutectic temperature. In one alloy, the eutectic composition 40A-60B, complete solidification occurs at a single temperature, the eutectic temperature. Although the freezing of the eutectic composition alloy thus resembles that of a pure metal, it is not congruent melting alloy since the resulting solid is composed of two phases (we will study this shortly in this article). The end product of a congruent melting alloy shall have only one phase.
The actual phase diagram may now be constructed by transferring the breaks on the cooling curves to a plot of temperature vs. composition, as shown in the figure given below.
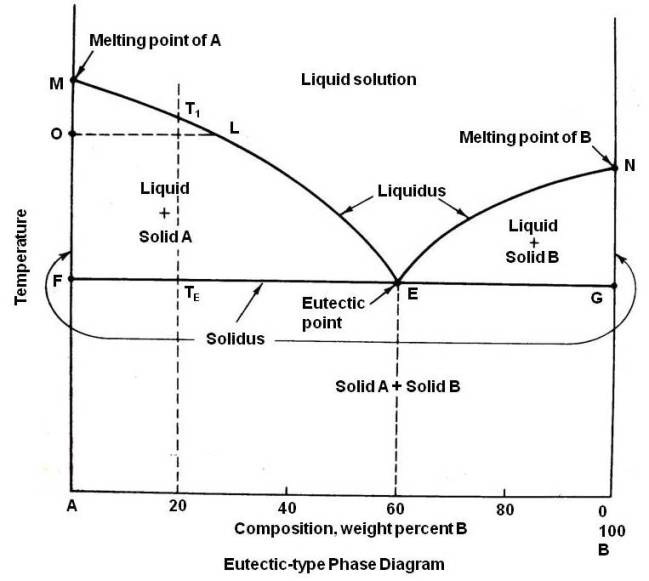
The melting points of the two pure metals, points M and N, are plotted on the vertical lines that represent the pure metals A and B. For an alloy having composition 80A-20B, the points showing the beginning of solidification T1 and end of solidification TE are plotted as shown. The same procedure is followed for all other alloys. The upper lines on the phase diagram connecting the points M, E and N is the liquidus line and shows the beginning of solidification. The point, at which the liquidus lines intersect, the minimum point E, is known as the eutectic point. TE is called the eutectic temperature and 40A-60B the eutectic composition. As solidus line is a continuous line connecting the melting points of pure metals, the complete solidus line is MFGN.
The phase diagram consists of four areas. The area above the liquidus line is a single-phase homogeneous liquid solution, since the two metals are soluble in the liquid state (labeled as Liquid solution). The remaining three areas are two-phase areas.
Every two-phase area on a phase diagram must be bounded along a horizontal line by single phases. Thus, if single-phase areas are labeled first, than the two-phase areas may be easily determined.
To determine the phases that exist in the two-phase area MFE in the above diagram, a horizontal tie line OL is drawn. This line intersects the liquidus at L, which means that liquid is one of the phases existing in the two-phase area and intersects the left axis at point O. The left axis represents a single phase, the pure metal A, which below melting point is solid. Therefore, the two phases existing in the area MFE are liquid and solid A (labeled as Liquid + Solid A). By the same logic, the two phases that exist in area NEG are liquid and solid B (labeled as Liquid + Solid B).
Since the two metals are assumed to be completely insoluble in the solid state, when freezing starts, the only solid that can form is a pure metal. Thus, every alloy when completely solidified must be a mixture of the two pure metals. Thus the area below FEG line in above diagram will be a mixture of two solid pure metals A and B (labeled as Solid A + Solid B).
It is common practice to consider alloys to the left of the eutectic composition as hypoeutectic alloys and those to the right as hypereutectic alloys.
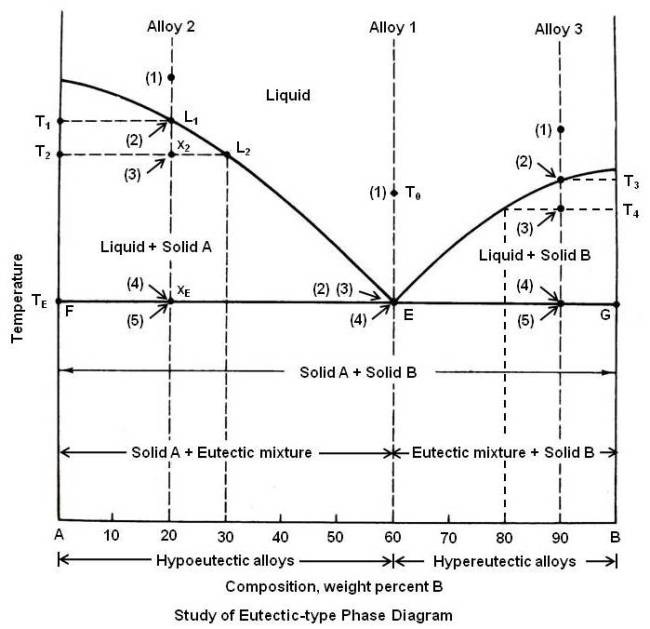
The way solidification takes place and resulting microstructures at various stages can be studied by following the slow cooling of different alloys. The process is explained by study of slow cooling of Alloy 1 (eutectic composition), Alloy 2 (hypoeutectic alloys) and Alloy 3 (hypereutectic alloys) in the figure given below.
Alloy 1 (Eutectic Composition)
Alloy 1 is the eutectic composition 40A-60B. As it is cooled from temperature T0, it remains a uniform liquid solution until it reaches point E, on the horizontal eutectic temperature line. Since this is the intersection of the liquidus and solidus lines, the liquid must now start to solidify, and the temperature cannot drop until the alloy is completely solid. The liquid will solidify into a mixture of two phases. These phases are always the ones that appear at either end of the horizontal eutectic-temperature line, in this case point F, which is pure metal A, and point G, the pure metal B.
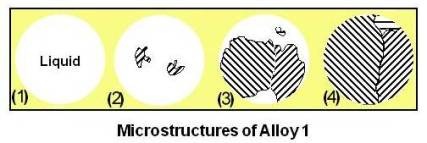
Let us assume that a small amount of pure metal A solidified. This leaves the remaining liquid richer in B; the liquid composition has shifted slightly to the right. To restore the liquid composition to equilibrium value, B will solidify. If slightly too much B is solidified, the liquid composition will have shifted to the left, requiring A to solidify to restore equilibrium. Therefore, at constant temperature, the liquid solidifies alternately pure A and pure B, resulting in extremely fine mixture usually visible only under the microscope. This is known as eutectic mixture shown at (4) in the above figure.
In the above figure at (1), the alloy is in liquid state. At (2), as the alloy starts to solidify, it forms alternate layers of pure A and pure B. This layered microstructure is known as lamellar microstructure and the layers are often only of the order of 1 micron across. The reason that a eutectic alloy forms in this way has to do with the diffusion times required to form the solid.
The grains grow by adding A to A and B to B until they encounter another grain as shown at (3). Further nucleation sites will also continue to form within the liquid parts of the mixture and solidification completes as shown at (4). This solidification happens very rapidly as the liquid reaches the eutectic temperature. It may be noted that though the points (2), (3) and (4) are shown separately, actually they are at the same location (all are pointed to E).
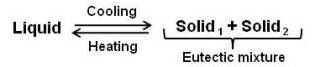
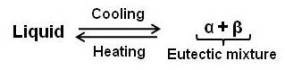
The change of this liquid of composition E into two solids at constant temperature is known as the eutectic reaction and may be written as
Since solidification of eutectic alloy occurs at constant temperature, its cooling curve would be the same as that for a pure metal or any congruent melting alloy. The eutectic solidification however is not congruent as there is a difference in composition between the liquid and the individual solid phases.
Alloy 2 (Hypoeutectic Alloys)
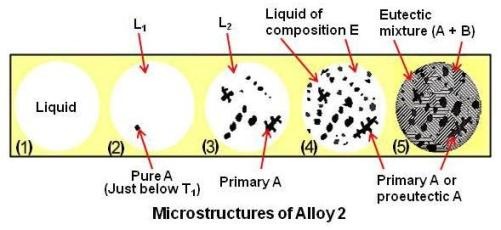
Alloy 2, a hypoeutectic alloy composed of 80A-20B, remains a uniform liquid solution as shown at (1) until the liquidus line temperature T1 is reached. At this point the liquid L1, is saturated in A, and as the temperature is dropped slightly, the excess A must solidify as shown at (2). The liquid by depositing crystals of pure A must become richer in B. It can be seen that at temperature T2, solid is pure A and liquid composition L2 is 70A-30B. The amount of A and L2 can be calculated using the Lever Rule as under.
A (percent) = (x2L2 / T2L2) x 100 = (10 / 30) x 100 = 33 percent
L2 (percent) = (T2x2 / T2L2) x 100 = (20 / 30) x 100 = 63 percent
The microstructure would appear as shown at (3). As the solidification continues, the amount of pure solid A increases gradually by continued precipitation from the liquid. The liquid composition, becoming richer in B, is slowly travelling downward and to the right along the liquidus curve, while the amount of liquid is gradually decreasing. When the alloy reaches xE, the eutectic line, the liquid is at point E. The conditions existing just a fraction of a degree above TE are:
| Phase | Liquid | Solid A |
|---|---|---|
| Chemical Composition | 40A-60B | 100A |
| Relative amount | (TExE / TEE) x 100 = 33 percent | (xEE / TEE) x 100 = 67 pecent |
The microstructure would appear as shown at (4). The remaining liquid (33 percent), having reached the eutectic point, now solidifies into the fine intimate mixture of A and B as described under alloy 1. When solidified, the alloy will consist of 67 percent of grains of primary or proeutectic A (which formed between T1 and TE or before the eutectic reaction) and 33 percent eutectic (A + B) mixture as shown at (5).
Every alloy to the left of the eutectic point E, when solidified, will consist of grains of proeutectic A and the eutectic mixture. The closer the alloy composition is to the eutectic composition, the more eutectic mixture will be present in the solidified alloy.
Alloy 3 (Hypereutectic Alloys)
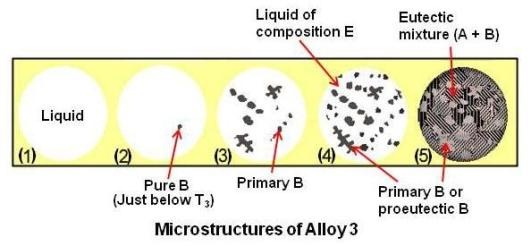
Alloy 3, a hypereutectic alloy composed of 10A-90B, undergoes the same cooling process as alloy 2 except that when the liquidus line is reached at temperature T3 the liquid deposits crystals of pure B instead of A as shown at (2). As the temperature is decreased, more and more of B will solidify, leaving the liquid richer in A. The amount of liquid gradually decreases, and its composition gradually moves down and to the left along the liquidus line until the point E is reached at the eutectic temperature. The remaining liquid now solidifies into the eutectic (A + B) mixture as shown at (5). After solidification the alloy will consist of 75 percent grains of primary B or proeutectic B and 25 percent eutectic (A + B) mixture.
Every alloy to the right of eutectic point, when solidified, will consist of grains of proeutectic B and the eutectic mixture (A + B).
The area below the solidus line and to the left of the eutectic composition is labeled Solid A + Eutectic mixture and that to the right, Solid B + Eutectic mixture.
Thus it is apparent that, regardless of alloy composition, the same reaction takes place whenever the eutectic-temperature line is reached, namely,
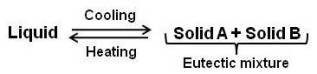
The above reaction applies specifically to the figure (diagram) given above. However, the eutectic reaction may be written in general as,

The only requirement being that the eutectic mixture consists of two different solid phases. This mixture may be two pure metals, two solid solutions, two intermediate phases, or any combination of the above.
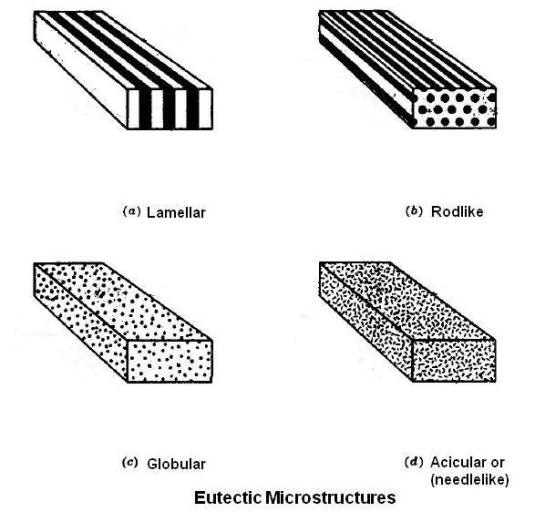
Microstructures different than lamellar type are also possible when eutectic reaction takes place. The different types of microstructures are as shown in the figure given below.
Two Metals Completely Soluble in the Liquid State but only Partly Soluble in the Solid State (Type III)
Since most metals have some solubility for each other in the solid state, this type is the most common alloy system.
The phase diagram of this type is shown in the figure given below.
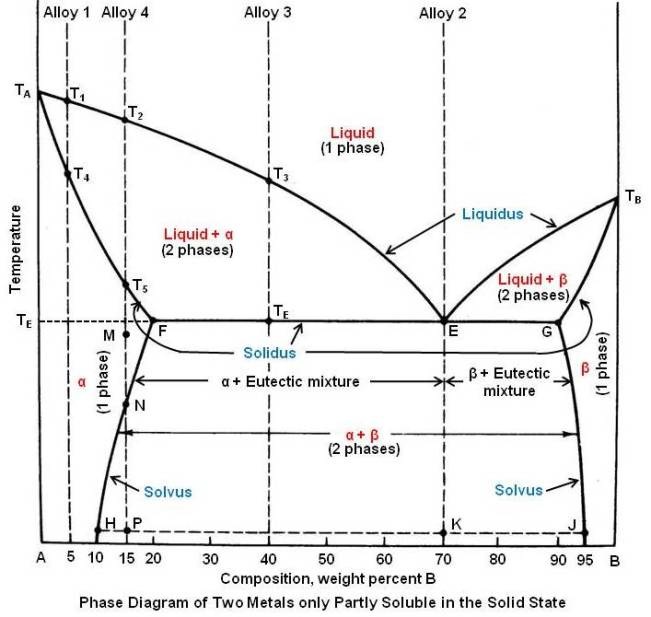
The melting points of the pure metals A and B are shown as TA and TB respectively. The liquidus line is TAETB, and the solidus line is TAFEGTB.
The single-phase areas are now labeled. Above the liquidus line, there is only single-phase liquid solution. At the melting points of pure metals (at melting point of A and melting point of B), where the liquidus and solidus lines meet, the diagram resembles the cigar-shaped diagram of Type I (complete solid solubility), and since these metals are partly soluble in the solid state, a solid solution must be formed. Alloys in this system never solidify crystals of pure A or pure B but always a solid solution or mixture of solid solutions. Thus the areas below melting points of pure metal A and pure metal B are the areas of single-phase α (alpha) and β (beta) solid-solutions. Since these solid solutions are next to the axes, they are known as terminal solid solutions.
The remaining three two-phase areas may now be labeled as liquid + α, liquid + β and α + β.
At TE, the α solid solution dissolves a maximum of 20 percent B as shown by point F and the β solid solution a maximum of 10 percent A as shown by point G. With decreasing temperature, the maximum amount of solute that can be dissolved decreases, as indicated by lines FH and GJ. These lines are called solvus lines and indicate the maximum solubility (saturated solution) of B in A (α solution) or A in B (β solution) as a function of temperature.
Point E, where the liquidus lines meet at a minimum, as in Type II, is known as the eutectic point.
The way solidification takes place and resulting microstructures at various stages can be studied by following the slow cooling of different alloys as under.
Alloy 1
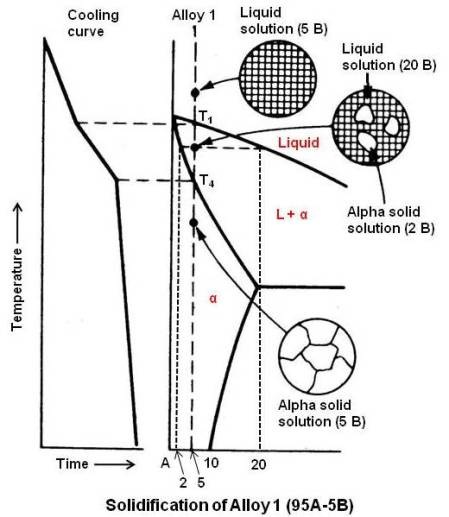
Alloy 1 composed of 95A-5B, when slowly cooled, will follow a process exactly the same as any alloy in Type I. When liquidus line is crossed at T1, it will begin to solidify by forming crystals of α solid solution extremely rich in A. The process continues, with the liquid getting richer in B and gradually moving down along the liquidus line. The α solid solution, also getting richer in B, is moving down along the solidus line. When the solidus line is finally crossed at T4 and with diffusion keeping pace with crystal growth, the entire solid will be a homogeneous α solid solution and will remain that way down to room temperature.
Alloy 2
Alloy 2, 30A-70B is the eutectic composition and remains liquid until the eutectic temperature is reached at point E. Since this is also the solidus line, the liquid now undergoes the eutectic reaction, at constant temperature, forming a very fine mixture of two solids. The two solids that make up eutectic mixture are given by the extremities of the eutectic-temperature line, α of composition F and β of composition G. The eutectic reaction may be written as
This reaction is the same as the one which occurred in the Type II diagram, except for the substitution of solid solutions for pure metals. The relative amounts of α and β in the eutectic mixture may be determined by the Lever Rule as under.
α (percent) = (EG / FG) x 100 = (20 / 70) x 100 = 28.6 percent
β (percent) = (EF / FG) x 100 = (50 / 70) x 100 = 71.4 percent
Because of the change in solubility of B in A, line FH, and of A in B, line GJ, there will be a slight change in the relative amounts of α and β as the alloy is cooled to room temperature. The relative amounts of α and β at room temperature are,
α (percent) = (KJ / HJ) x 100 = (25 / 85) x 100 = 29.4 percent
β (percent) = (HK / HJ) x 100 = (60 / 85) x 100 = 70.6 percent
Compositions of the two solid solutions that make up eutectic mixture are given by the composition existing on either end of the tie line HKJ, α of composition H (90A-10B) and β of composition J (5A-95B).
Alloy 3
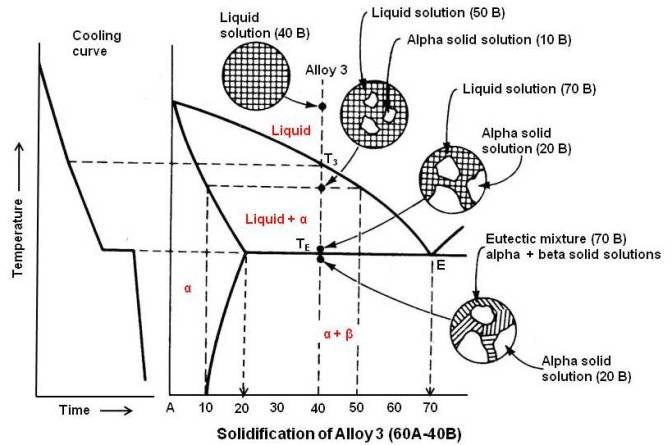
Alloy 3, 60A-40B, remains liquid until the liquidus line is reached at T3. The liquid starts to solidify crystals of primary α solid solution very rich in A. As the temperature decreases the liquid becomes richer and richer in B, gradually moving down and to the right along the liquidus line until it reaches point E. Just above the eutectic temperature TE, there exist two phases as under.
| Phase | Liquid | Primary α |
|---|---|---|
| Chemical Composition | 30A-70B | 80A-20B |
| Relative Amounts | 40 percent | 60 percent |
Since the remaining liquid (40 percent) is at point E, the right temperature and composition to form the eutectic mixture, it now solidifies by forming alternately crystals of α and β of the composition appearing at the ends of the eutectic temperature line (points F and G). The temperature does not drop until solidification is complete.
As the alloy cools to room temperature because of the change in solubility, as shown by the solvus line FH, some excess β is precipitated from the solution.
Alloy 4
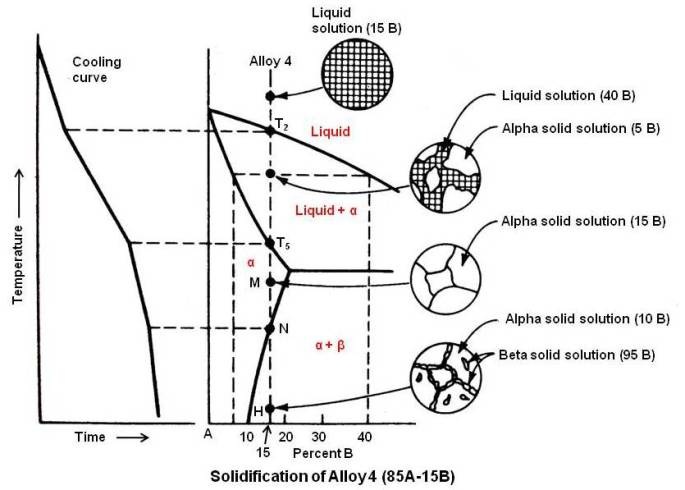
Alloy 4, 85A-15B, initially follows the same process as described for Alloy I. Solidification starts at T2 and is complete at T5, the resultant solid being a homogeneous single phase, the α solid solution (85A-15 B). At M, the solution is unsaturated. The solvus line FH as explained previously, shows the decrease in solubility of B in A with decreasing temperature. As the alloy cools, the solvus line is reached at point N. The α solution is saturated in B. Below this temperature, under slow cooling, the excess B comes out of solution. Since A is soluble in B, the precipitate does not come out as the pure metal B but as β solid solution. At room temperature, the alloy will consist mostly of α with a small amount of excess β, primarily along the grain boundaries. The excess β can be determined by applying the Lever Rule at the line HJ as under.
β (percent) = (HP / HJ) x 100 = (5 / 85) x 100 = 5.88 percent
If the β phase is relatively brittle, the alloy will not be very strong or ductile. The strength of an alloy to a large extent is determined by the phase that is continuous through the alloy. In this case, although the β solution constitutes only about 6 percent of the alloy, it exists as a continuous network along the grain boundaries. Therefore, the alloy will tend to rupture along these boundaries. This alloy, however, may be made to undergo a significant change in strength and hardness after being properly heat treated.
Properties in Eutectic Alloy Systems
The properties of any multiphase alloy depend upon the individual characteristics of the phases and how these phases are distributed in the microstructure.
In many commercially important eutectic alloy systems, one phase is relatively week and plastic while the other phase is relatively hard and brittle. As the eutectic composition is approached from the plastic-phase side, there will be an increase in the strength of the alloy. There will be a decrease in strength beyond the eutectic composition due to the decrease in the amount of the small eutectic particles and the increase in size and amount of the proeutectic brittle phase. Therefore, in this kind of system, the eutectic composition will generally show maximum strength.
Age Hardening
There are two methods to increase the strength and hardness of an alloy. They are cold working and heat treatment. The most important heat treatment process for nonferrous alloys is age (precipitation) hardening. In order to carry out age hardening, the equilibrium diagram must show partial solubility, and the slop of solvus line must be such that there is higher solubility at a higher temperature than at a lower temperature. These conditions are satisfied in Alloy 4 of Type III diagrams. To illustrate the process, left side of the diagram involving α solid solution is considered. Please refer to the phase diagram for Type III (Two Metals Completely Soluble in the Liquid State but only Partly Soluble in the Solid State).
Alloy compositions that can be age hardened are usually chosen between point F containing 20 percent B and point H containing 10 percent B. Commercially most age hardenable alloys are chosen of compositions slightly to the left of point F, although the maximum hardening effect would be obtained by an alloy containing 20 percent B. The phase which is dissolvable may be a terminal solid solution, as in this case or a compound (an intermediate alloy phase).
Two stages are generally required in heat treatment to produce age hardening: solution treatment and aging.
Solution Treatment
If Alloy 4 (85A-15B) of Type III phase diagram [having microstructure shown at (a) in the figure given below] is reheated to point M, all the excess β will be dissolved and the structure will be a homogeneous α solid solution.
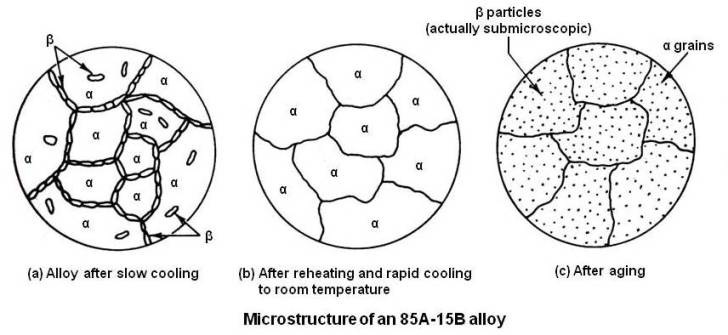
The alloy is now cooled rapidly (quenched) to room temperature. The quenching is generally carried out in a cold water bath or by a water spray. Drastic quenching may result in distortion in intricately designed parts. In such cases, boiling water is used as quenching media to minimize distortion. If α is a ductile phase, the alloy will be ductile immediately after quenching. This allows warped or distorted parts to be straightened easily. In view of this, straightening operation should be carried out as soon as possible after quenching. The microstructure is shown schematically at (b) in the above figure.
Aging Process
The alloy, as quenched, is a supersaturated solid solution and is in an unstable state. The excess solute will tend to come out of solution. The speed at which precipitation occurs varies with temperature.
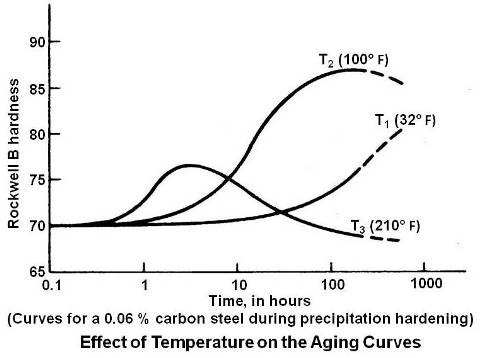
Above figure shows the effect of three temperatures on the aging process. At the low temperature diffusion rate is so slow that no appreciable precipitation occurs. At T3, hardening occurs quickly, due to rapid diffusion but, softening effects are also accelerated, resulting in a lower maximum hardness. The optimum temperature seems to be T2, at which maximum hardness occurs within a reasonable length of time.
Those alloys in which precipitation occurs at room temperature so that they obtain their full strength after 4 or 5 days at room temperature are known as natural aging alloys. Those alloys which require reheating to elevated temperature to develop their full strength are called artificial aging alloys. It may be noted that refrigeration retards the rate of natural aging. It can be seen in the above figure that at 32° F, the beginning of the aging process is delayed for several hours.
It is not possible to state definitely in what manner precipitate particles harden the matrix or solvent lattice. There are several theories of precipitation hardening; the most useful is the coherent lattice theory.
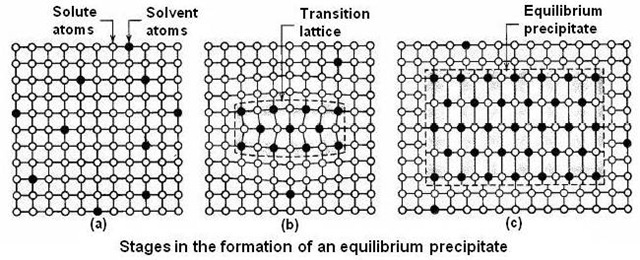
After solution treatment and quenching, the alloy is in a supersaturated condition, with the solute atoms distributed at random in the lattice structure as shown at (a) in above figure.
During an incubation period, the excess solute atoms tend to migrate to certain crystallographic planes, forming clusters or embryos of the precipitate. During aging, these clusters form an intermediate crystal structure, or transition lattice, maintaining registry (coherency) with the lattice structure of the matrix. The excess phase will have different lattice parameters from those of the solvent, and as a result of atom matching (coherency), there will be considerable distortion of the matrix as shown at (b) in the above figure. The distortion of the matrix extends over a large volume than would be the case if the excess phase were a discrete particle. It is this distortion that interferes with the movement of dislocations and accounts for the rapid increase in hardness and strength during aging.
Eventually, the equilibrium excess phase is formed with its own lattice structure as shown at (c) in above figure. This causes a loss of coherency with the matrix and less distortion. Hardness and strength will decrease, and the alloy is called over-aged. There will now be a boundary between the excess phase and the matr18ix so that the precipitated particle will be visible under the microscope.
Thus for maximum strength, care shall be taken not to over-age the material and to retain the strength, the material shall not be used in an application where temperature may over-age it.
Strengthening particles are obtained most usually by the precipitation process in the matrix during heat treatment (artificial aging) as explained above. In steel this is most familiar during tempering of quench hardened medium carbon steels.
Congruent-melting Intermediate Phase (Type IV)
When one phase changes into another phase isothermally (at constant temperature) and without any change in chemical composition, it is said to be congruent phase change or congruent transformation. All pure metals solidify congruently.
Compounds are called intermediate phases because they are single phases that occur between the terminal phases on a phase diagram.
Any intermediate phase may be treated as another component on a phase diagram. If the intermediate phase has a narrow range of composition, as in cases of intermetallic compounds and interstitial compounds, it is than represented on the diagram as a vertical line and labeled with the chemical formula of the compound. If the intermediate phase exists over a range of composition, it is usually an electron compound and is labeled with a Greek letter.
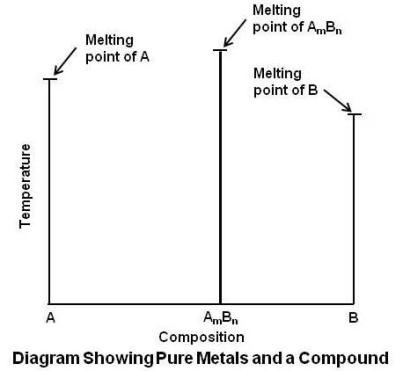
In the above figure, the intermediate alloy phase is shown as a vertical line. Since it is a compound, it is indicated as AmBn, where m and n are subscripts which indicate the number of atoms combined in the compound.
It is apparent from the figure that the A-B system may be separated into two independent parts, one to show all the alloys between A and the compound AmBn and the other to show those between AmBn and B. The portion of the diagram between A and AmBn may be any of the types studied in the articles on phase diagrams, similarly for the portion between AmBn and B.
If the compound shows no solubility for either pure metal and the pure metals show some solubility for each other, the equilibrium diagram will look as shown in the figure given below.
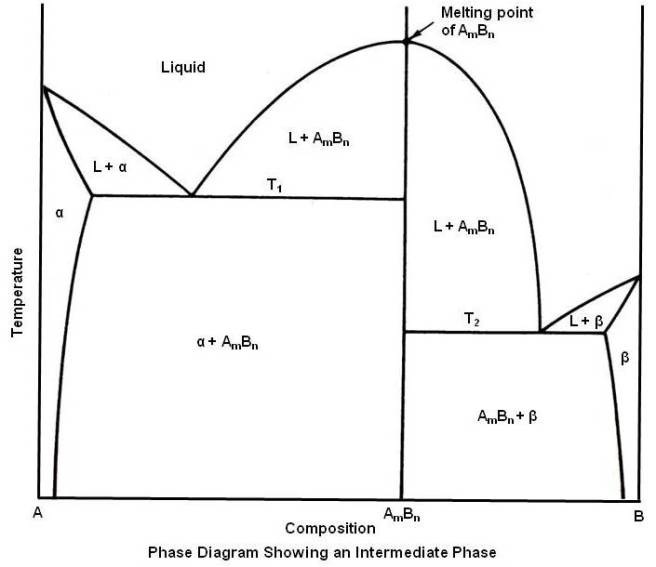
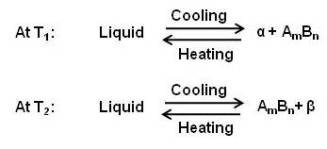
Above diagram shows two different eutectic mixtures. The eutectic equations may be written as under.
The Peritectic Reaction (Type V)
In the peritectic reaction a liquid and a solid react isothermally to form a new solid on cooling. The reaction is expressed in general as under.
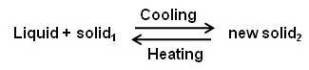
The new solid formed is usually an intermediate phase as shown in the figure given below, but in some cases it may be a terminal solid solution.
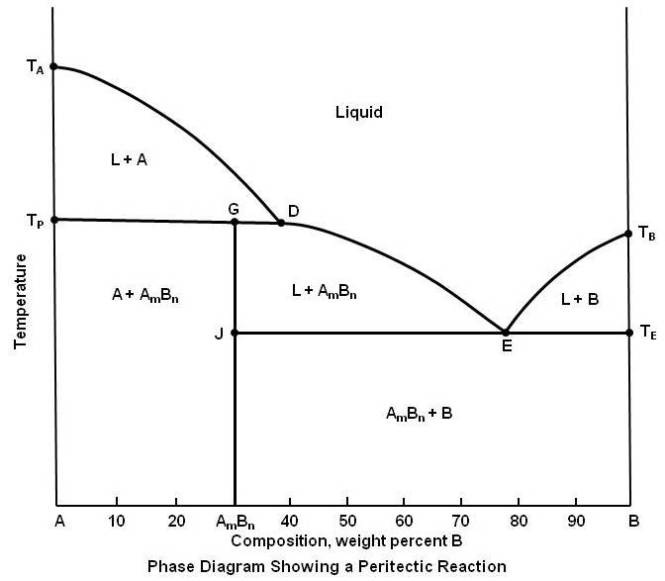
It can be seen in the above figure that the compound AmBn, 70A-30B, when heated to the peritectic temperature, point G, decomposes into two phases, liquid and solid A. Therefore, it can be said that it is an incongruent melting intermediate alloy.
It can be seen that the peritectic reaction is just the reverse of the eutectic reaction, where a single phase formed two new phases on cooling.
The liquidus line is TADETB and the solidus line is TATPGJTETB. The peritectic reaction line is TPD. Notice that only part of this line, the length TPG, coincides with the solidus line.
Transformations in the Solid State
There are several equilibrium changes and reactions which take place entirely in the solid state. They are known as transformations in the solid state.
Allotropy Change
Several metals may exist in more than one type of crystal structure depending upon their temperature. This property of a metal is called allotropy. Iron, manganese, cobalt and tin have this property. On equilibrium diagram, allotropic change is indicated by a point on the vertical line for pure metals.
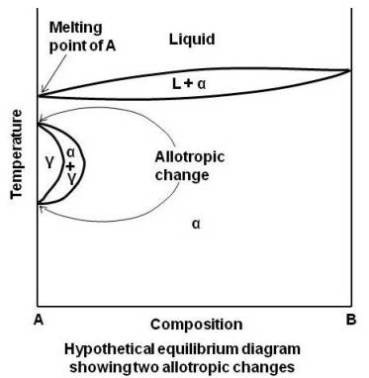
In the above figure, the gamma solid solution field is looped. The pure metal A and alloy rich in A undergo two transformations. Many of the equilibrium diagrams involving iron such as Fe-Mo and Fe-Cr show this type of looped solid solution field. Since the type of iron that exists in this temperature range is gamma iron, the field is usually called the gamma loop. However, it is not a must for all alloys to form loop. In some alloy systems involving iron for example, iron and nickel, the gamma loop is not closed.
Order-disorder
Ordinarily in the formation of a substitutional type of solid solution the solute atoms do not occupy any specific position but are distributed at random in the lattice structure of the solvent. The alloy is said to be in a disordered condition. Some of these random solid solutions, if cooled slowly, undergo a rearrangement of the atoms where the solute atoms move into definite positions in the lattice. This structure as shown in figure below is now known as ordered solid solution or superlattice.
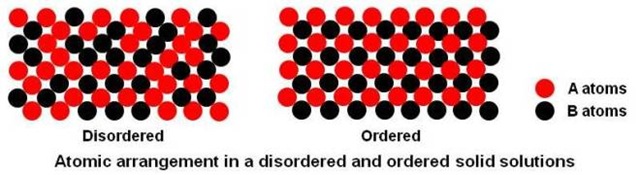
Order is most common in metals that are completely soluble in the solid state, and usually the maximum amount of ordering occurs at a simple atomic ratio of the two elements. For this reason, the ordered phase is sometimes given a chemical formula, such as AuCu and AuCu3 in the gold-copper alloy system.
The effect of ordering on mechanical properties is negligible. However there is a significant reduction in electrical resistance.
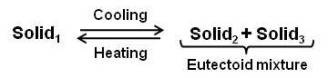
The Eutectoid Reaction
This is a common reaction in the solid state. It is very similar to eutectic reaction but does not involve the liquid. In this case, a solid phase transforms on cooling into two new solid phases. The general equation may be written as under.
The resultant eutectoid mixture is extremely fine, just like the eutectic mixture. Under the microscope both mixtures generally appear the same. An equilibrium diagram illustrating the eutectoid reaction is shown in the figure given below.
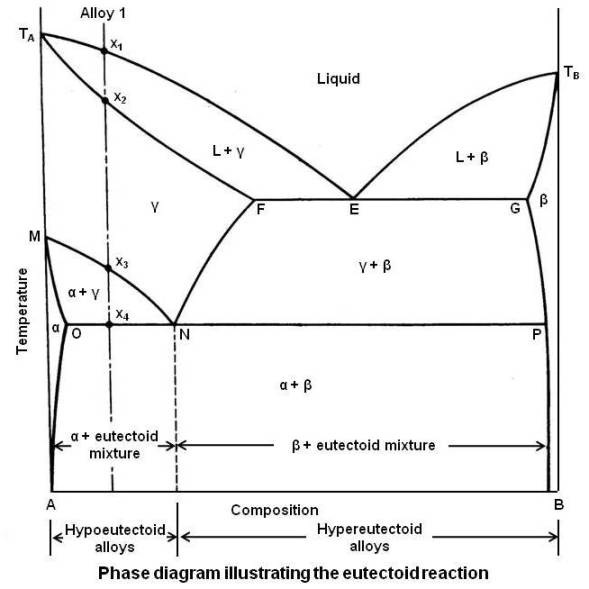
The liquidus line is TAETB and the solidus line is TAFGTB. The eutectic mixture is composed of the phases that occur at both ends of the eutectic temperature line, namely, γ solid solution (point F) and β solid solution (point G).
Point M indicates an allotropic change for pure metal A. The significance of the solvus line MN is that, as the alloy composition is increased in B, the temperature at which the allotropic change takes place is decreased, reaching to a minimum at point N. The solvus line FN shows the decrease in solubility of B in γ as the temperature is decreased. Point N is known as eutectoid point. Its composition is the eutectoid composition, and the line OP is the eutectoid temperature line. Like the eutectic diagram, it is common practice to call all alloys to the left of eutectoid composition (point N) hypoeutectoid alloys and those to the right hypereutectoid alloys.
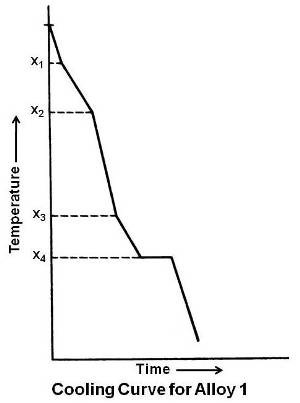
When the hypoeutectoid Alloy 1 is slowly cooled, γ solid solution is formed when the liquidus line is crossed at x1. More and more γ is formed until the solidus line is crossed at x2. It remains a uniform solid solution until the solvus line is crossed at x3. The pure metal A must now start to undergo an allotropic change, forming the α solid solution. It may be seen that the α solid solution dissolves much less of B than does the γ solid solution. Some of B atoms that are dissolved in the area that will undergo the allotropic change must now diffuse out of that area. When sufficient diffusion of B atoms has taken place, the remaining A atoms rearrange themselves into the new crystal structure, forming the α solid solution. The excess B atoms dissolve in the remaining γ solid solution, which becomes richer in B as the temperature falls. The composition of the remaining γ is gradually moving down and to the right along the solvus line MN. When the alloy reaches the eutectoid temperature x4, the remaining γ has now reached the eutectoid point N. The significance of the eutectoid line is that this temperature is the end of the crystal structure change that started at x3, and remaining γ must now transform by the eutectoid reaction, forming alternate layers of α and β in extremely fine mixture. The reaction may be written as under.
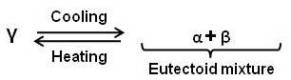
The microstructure at room temperature consists of primary α or proeutectoid α which was formed between x3 and x4, surrounded by the eutectoid mixture of α + β.
In drawing the cooling curve for a given alloy from the phase diagram, it is important to remember that – whenever a line is crossed on the phase diagram, there must be a corresponding break in the cooling curve. Also, when a horizontal line is crossed, on the phase diagram, indicating a reaction, this will show on the cooling curve as a horizontal line. The cooling curve for Alloy 1 is shown in the following figure.
The Peritectoid Reaction
This is a fairly common reaction in the solid state and appears in many alloys. The peritectoid reaction may be written in general as under.
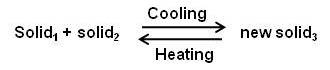
The new solid phase is usually an intermediate alloy, but it may also be a solid solution. The peritectoid reaction has the same relationship to the peritectic reaction as the eutectoid has to eutectic. Essentially, it is the replacement of a liquid by a solid.
Acknowledgement:
This article is written based on the book – Introduction to Physical Metallurgy by Sidney H. Avner, published by Tata McGraw-Hill Publishing Company Limited, New Delhi, India.
