Quenching is very impotent in hardening operation. Information about mechanism of heat removal during quenching and factors determining the actual cooling rate is given in this article. Information about hardenability, the relative ability of steel to be hardened by quenching is also given in this article.
Mechanism of Heat Removal During Quenching
The structure, hardness and strength resulting from a heat treatment operation are determined by the actual cooling rate obtained by the quenching operation.
If the actual cooling rate exceeds the critical cooling rate, only martensite will form. However, if the actual cooling rate is less than the critical cooling rate, other products like ferrite, pearlite and bainite will also form depending on the cooling rate along with formation of martensite. Due to this, the part will not completely harden. The greater the difference between the two cooling rates, the softer will be the transformation products and the lower the hardness. Many factors determine the actual cooling rate. For their study, mechanism of hear removal during quenching is explained below by an illustration.
A typical cooling curve for a small steel cylinder quenched in warm water is shown in the figure given below.
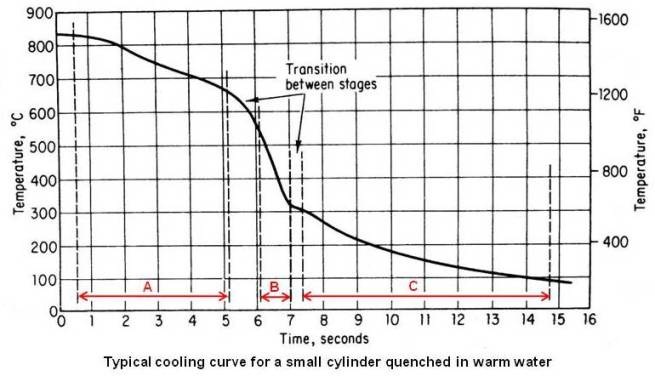
Instead of showing a constant cooling rate through out the quench, the cooling curve shows three stages.
Remember the difference between a cooling curve and a cooling rate. A cooling curve shows the variation of temperature with time during quenching. A cooling rate, however, shows the rate of change of temperature with time. The cooling rate at any temperature may be obtained from the cooling curve by drawing a tangent to the curve at that temperature and determining the slop of the tangent. The more nearly horizontal the tangent, the slower is the cooling rate. It can be seen in the above figure that the cooling rate is constantly changing during cooling.
Stage A – Vapor-blanket Cooling State
In this first stage, the temperature of the metal is so high that the quenching media is vaporized at the surface of the metal and a thin stable film of vapor surrounds the hot metal. Cooling is by conduction and radiation through the gaseous film, and since vapor films are poor heat conductors, the cooling rate is relatively slow through this stage.
Stage B – Vapor-transport Cooling Stage
This stage starts when the metal has cooled to a temperature at which the vapor film is no longer stable. Wetting of the metal surface by the quenching medium and violent boiling occurs. Heat is removed from the metal very rapidly as the latent heat of vaporization. This is the fastest stage of cooling.
Stage C – Liquid Cooling Stage
This stage starts when the surface temperature of the metal reaches the boiling point of the quenching liquid. Vapor no longer forms, so cooling is by conduction and convection through the liquid. The rate of cooling is slowest in this stage.
Factors Determining the Cooling Rate
The four most important factors determining the actual cooling rate are the type of quenching medium, the temperature of the quenching medium, the surface condition of the part and the size and mass of the part.
Quenching Medium
In view of the mechanism of heat removal, the idle quenching medium would show a high initial cooling rate to avoid transformation in the nose region of the I-T diagram and then a slow cooling rate through out the lower-temperature range to minimize distortion. However, there is no quenching medium that show such ideal properties.
Water and water solutions of inorganic salts have high initial cooling rates through the A and B stages, but these high cooling rates persist to low temperature where distortion and cracking may occur. Conventional quenching oils have a longer A stage and a shorter B stage with a slower rate of cooling. Industrial quenching media listed in order of decreasing quenching severity are as under.
1. Water solution of 10 percent sodium chloride (brine)
2. Tap water
3. Fused or liquid salts
4. Soluble oil and water solutions
5. Oil
6. Air
The cooling curves obtained by different media in the center of a ½ in. diameter stainless steel bar are shown in the figure given below.
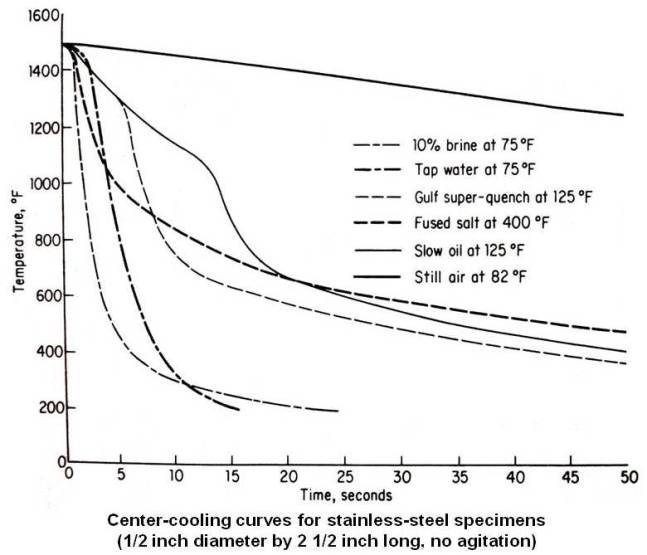
The curve furthest to left is a 10 percent brine solution at 75°F. This quenching media has a very short vapor stage lasting about 1 s and then drops quickly into the boiling stage, where the cooling rate is very rapid. It finally goes into the third stage at about 10 s.
The fused salt has a very short vapor stage. However, the cooling rate during the boiling stage is not as rapid as that for brine or tap water. It reaches the third stage at about 10 s.
Gulf super-quench oil at 125°F show relatively long vapor stage and enters boiling stage after about 7 s. It reaches third stage after about 15 s.
The cooling curve for still air at 82°F never gets out of the vapor stage and therefore shows a very slow cooling rate over the entire range.
The usual methods of comparing the quenching speed of different media are by determining the rate of cooling at some fixed temperature or the average rate between two temperatures. Rate of cooling at 1300°F in °F/s for several media are given in the table given below.
| Bath | Rate of cooling at 1300°F in °F/s | |
|---|---|---|
| Bath Temperature 75°F | Bath Temperature 125°F | |
| Brine (10%) | 382 | 296 |
| Tap water | 211 | 146 |
| Gulf Super-Quench | 80 | 85 |
| Slow oil | 36 | 32 |
| 10% soluble oil, 90% water | 36 | 30 |
| Still air | 5 | - |
| Fused salt (at 400°F) | 162 | |
Temperature of Quenching Media
Generally, as the temperature of the media rises, the cooling rate decreases. This is due to the increase in persistence of the vapor-blanket stage. Since the medium is closer to its boiling point, less heat is required to form the vapor film.
In case of oil, there are two opposing factors to be considered. As the temperature of oil rises there is a tendency for the cooling rate to decrease due to persistence of the vapor film. However, as the temperature of oil rises it also becomes more liquid, which increases the rate of heat conduction through the liquid. What happens to the cooling rate is determined by which factor has the greatest influence.
To prevent a temperature rise in the medium during quenching, it is always necessary to provide sufficient volume of medium. In some cases, cooling coils are inserted in the quenching tank to control the temperature of the medium.
The cooling rate may be improved and the temperature of the medium kept constant by circulation of the medium (better effect with increase in velocity of the fluid moving past the surface) and agitation of the piece. This effectively wipes off the vapor film as quickly as it forms, reducing the length of the vapor-blanket stage, and results in faster cooling.
Surface Condition
When steel is exposed to an oxidizing atmosphere, because of the presence of water vapor or oxygen in the furnace a layer of iron oxide called scale is formed. A thin layer of scale has little effect on the actual cooling rate, but a thick layer of scale (0.005 in. deep) retards the actual cooling rate. There is also the tendency for parts of the scale to peel off the surface when the piece is transferred from the furnace to the quenching tank, thus giving rise to a variation in cooling rate at different points on the surface. Many methods are used in industry to minimize the formation of scales and thus the formation of scale is usually avoided in commercial heat treatment. The presence of scale need to be considered only if the actual cooling rate is very close to the critical cooling rate.
Size and Mass
Since it is only the surface of a part which is in contact with the quenching medium, the ratio of surface area to mass is an important factor in determining the actual cooling rate. This ratio is a function of the geometric shape of the part. Thin plates and small diameter wires have a large ratio of surface area to mass and therefore rapid cooling rates. This is explained by an experiment on a medium carbon steel of about 0.45 percent carbon as under.
A series of pieces ranging from ½ to 5 in. diameter were heated to the proper austenitizing temperature and quenched in water. When the surface hardness was measured on these pieces, the following values were found.
| Diameter of piece water quenched, in. | Surface hardness, Rockwell C |
|---|---|
| 0.5 | 59 |
| 1 | 58 |
| 2 | 41 |
| 3 | 35 |
| 4 | 30 |
| 5 | 24 |
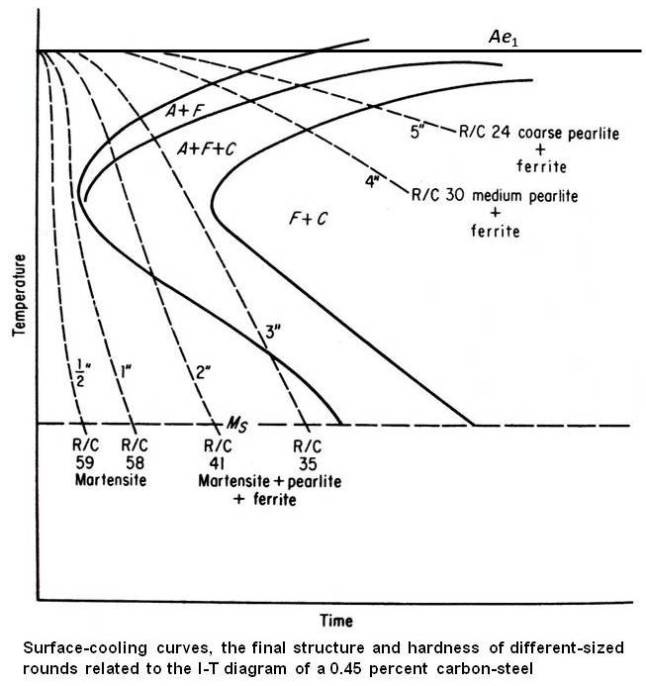
From the above data we can conclude that the actual cooling rate at the surface of the ½ and 1 inch pieces exceeded the critical cooling rate for this steel, so that a fully martensite structure was obtained with maximum hardness. The surface of the 2 and 3 inch pieces received intermediate cooling, and the structure is probably a mixture of martensite, fine pearlite and a small amount of ferrite. The surface of the 4 and 5 inch pieces received slow cooling, with a resulting structure of pearlite and ferrite. As a matter of fact, for the 5 inch piece, the amount of heat to be removed is so large compared with the surface area available that the water quench is ineffective, and very nearly the same hardness would have been obtained if that piece had been cooled in the furnace. The approximate relation of the actual cooling curves of the surface to the I-T diagram is shown in the figure given below.
The surface, being in actual contact with the quenching medium cools most rapidly on quenching. However, the cooling rate in the interior is less than that at the surface. The heat in the interior of the piece must be removed by conduction, through the body of the piece, eventually reaching the surface and the quenching medium. Figure given below shows the time-temperature cooling curves at different locations in a 1 in. diameter bar during a drastic quench.
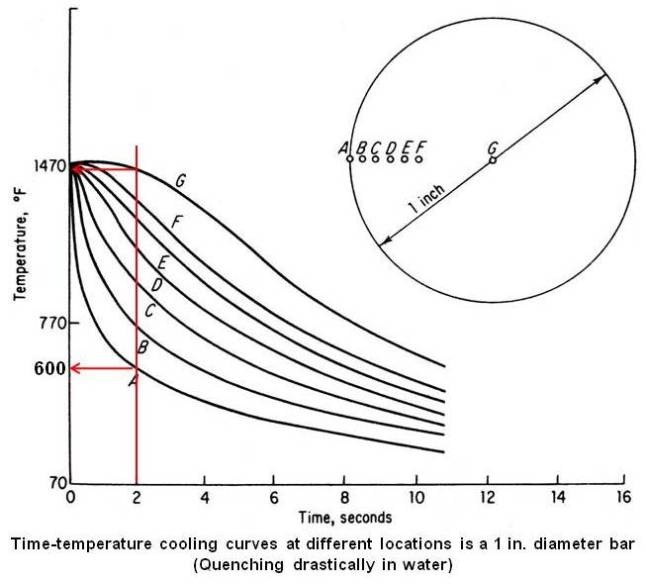
The figure shows a wide variation in cooling rates across the radius of the bar. This will result in a wide variation in the hardness at various locations across the cross section. It can be seen that there is a considerable temperature difference between the surface and the center during quenching. If a vertical line is drawn at 2 s intersecting the curves, the surface will have come down to approximately 600°F while the center is still at about 1470°F. Therefore there is a temperature difference of about 870°F between the surface and the center at the end of 2 s. This temperature difference will give rise to stresses during heat treatment which may result in distortion and cracking of the piece.
The results of hardness survey of the different diameters, whose surface hardness was previously mentioned (table given above) are shown in the figure given below (for SAE 1045).
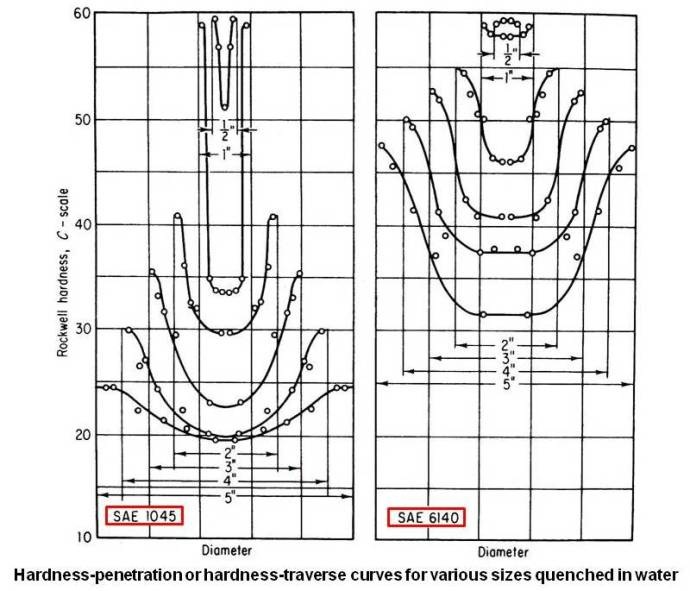
This may be called a hardness-penetration or hardness-traverse diagram, since it shows at a glance to what extent the steel has hardened during quenching. Hardenability is related to the depth of penetration of the hardness, and in no case has the hardness penetrated deeply, so that this steel is said to have low hardenability. It can be seen that the hardness of the quenched piece is less as its size increases, and also that each piece is lower in hardness at the center than at the surface.
Increase in the hardenability or depth of penetration of the hardness may be accomplished by either of two methods.
- With the actual cooling rates fixed, slow up the critical cooling rate (shift the I-T curve to the right) by adding alloying elements or coarsening the austenitic grain size.
- With the I-T curve fixed, increase the actual cooling rates by using a faster quenching medium or increasing circulation.
Since increasing cooling rates increase the danger of distortion or cracking, the addition of alloying elements is the more popular method of increasing hardenability. In the above figure, the hardness-penetration diagrams, after water quenching, different-size rounds of a chromium-vanadium steel (SAE 6140) of about the same carbon content as for SAE 1045 are shown on the right side. It can be seen that the hardness level of all sizes has been raised appreciably.
It may be noted that in above case if the actual cooling rate is reduced by using an oil quench, the hardness levels will reduce in case of both type of steels but hardness levels obtained for SAE 6140 steel will be more than that for SAE 1045 type steel.
Hardenability
Hardenability is the relative ability of steel to be hardened by quenching. It is essentially a measure of the cooling rate at which martensite will form. If martensite will form for slow cooling rates, then the steel has a high hardenability.
Hardenability of a steel should not be confused with the hardness of a steel. The Hardness of a steel refers to its ability to resist deformation when a load is applied, whereas hardenability is a measure of the depth to which steel will harden when quenched (under a particular set of conditions) from its austenitizing temperature
It is therefore necessary to have a test that will predict the hardenability of the steel. The most widely used method of determining hardenability is the end-quench hardenability test, or the Jominy test.
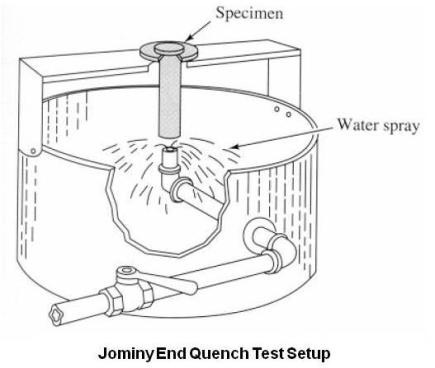
The test has been standardized by the ASTM, SAE, and AISI. In conducting this test, a 1 in. round specimen 4 in. long is heated uniformly to proper austenitizing temperature. It is then removed from the furnace and placed on a fixture where a jet of water impinges on the bottom face of the specimen as shown in the above figure. The size of the orifice, the distance from the orifice to the bottom of the specimen, and the temperature and circulation of the water are all standardized, so that every specimen quenched in this fixture receives the same rate of cooling. After 10 minutes on the fixture, the specimen is removed, and two parallel surfaces are ground longitudinally to a depth of 0.015 in. Rockwell C scale hardness readings are taken at 1/16 in. intervals from the quench end. Since each distance along the quenched bar is equivalent to a certain actual cooling rate, one can plot Rockwell C hardness vs. actual cooling rate as Rockwell C hardness vs. distance. Due to this, the results are expressed as a curve of hardness values vs. distance from the quench end.
Because the cooling rate decreases as one moves further from the quenched end, one can measure the effects of a wide range of cooling rates from vary rapid at the quenched end to very slow at air-cooled at the far end. The table given below gives cooling rates at distances from the water-cooled end of the standard end-quenched hardenability test bar.
| Distance from Quenched End, in. |
Cooling Rate °F/s at 1300°F |
Distance from Quenched End, in. |
Cooling Rate °F/s at 1300°F |
|---|---|---|---|
| 1/16 | 490 | 11/16 | 19.5 |
| 1/8 | 305 | 3/4 | 16.3 |
| 3/16 | 195 | 13/16 | 14.0 |
| 1/4 | 125 | 7/8 | 12.4 |
| 5/16 | 77.0 | 15/16 | 11.0 |
| 3/8 | 56.0 | 1 | 10.0 |
| 7/16 | 42.0 | 1 ¼ | 7.0 |
| 1/2 | 33.0 | 1 ½ | 5.1 |
| 9/16 | 26.0 | 1 ¾ | 4.0 |
| 5/8 | 21.4 | 2 | 3.5 |
Jominy Number
The location of a certain hardness can be described by a Jominy number by Jx = y, where x = hardness number (Rockwell C scale) and y = distance from quenched end (expressed as y/16 in.).
A Rockwell hardness of 35 RC at 5/16 in. from the quenched end is written as a Jominy number J35 = 5 (where x = 35 and y = 5).
A Rockwell hardness of 30 RC at 1/2 in. from the quenched end is written as a Jominy number J30= 8 (where x = 30 and y = 8).
For more detail on Jominy test, please refer to ASTM A255 – Standard Test Methods for Determining Hardenability of Steel.
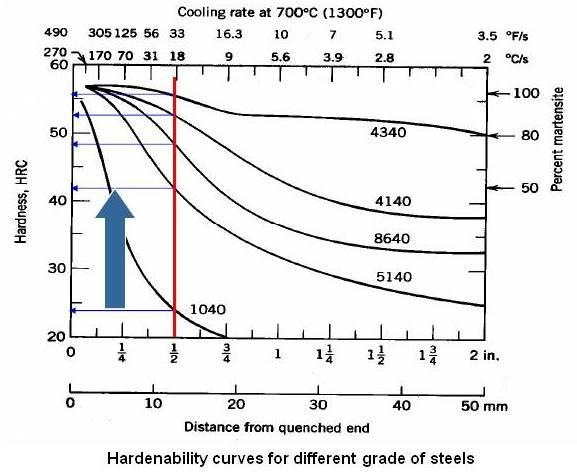
Above figure shows hardenability curves for different grades of steel.
There are plots in the literature that can be used which gives the cooling rates experienced for any point in a steel specimen of a particular size, geometry and quench. Once the cooling rate is known, the hardness can be determined from the hardenability curve.
AISI has established minimum and maximum hardenability curves known as hardenability bends. A typical hardenability band is shown in the figure given below for 4140H steel. A suffix H denotes steels that may be brought on the basis of hardenability specification, with chemical composition, grain size, etc., being of secondary importance.
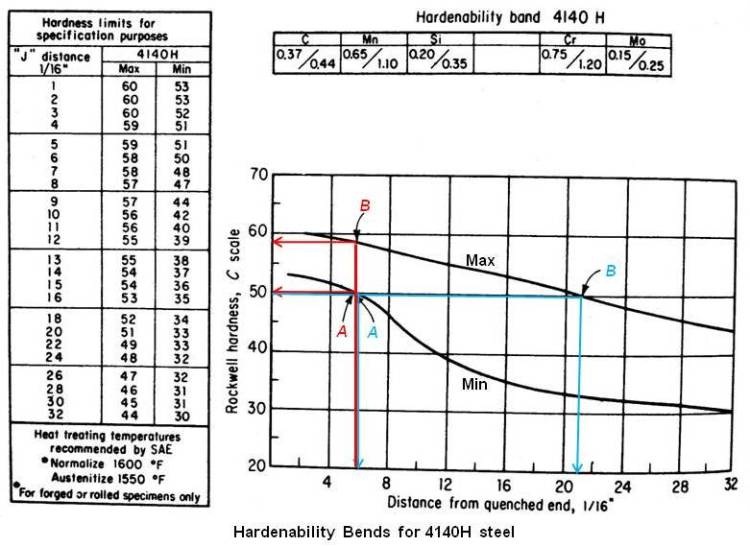
Two points are usually designated in specifying hardenability by one of the following two methods.
- Minimum and maximum hardness values at any desired distance. The distance selected should be that distance on the end-quenched test bar which corresponds to the section used by the purchaser. For example, in the above figure, the specification could be J50/58 = 6/16 in.
- The minimum and maximum distances at which desired hardness value occur. By this method of specification, in above figure could be J50 = 6/16 to 21/16 in.
When steel is purchased on the basis of a hardenability specification, the purchase is certain that he will obtain the desired mechanical properties after heat treatment. This results in fewer rejections and better economy.
